> ## Documentation Index
> Fetch the complete documentation index at: https://docs.supermisson.fun/llms.txt
> Use this file to discover all available pages before exploring further.
# Reading Market Prices
> YES + NO = $1. Price = probability. Here's how to read every number on the screen like a trader.
# Reading the numbers
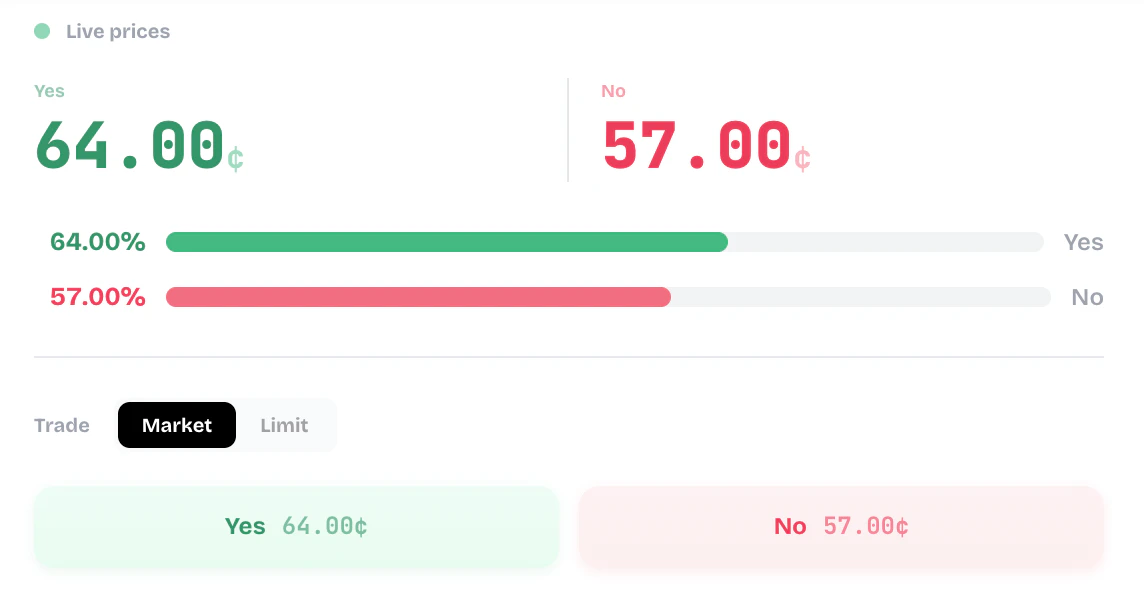 Every number on a market card is telling you something. Once you learn to read them, you see the market differently. This takes 2 minutes.
## Price = probability
The single most important thing to internalize:
**A YES price of `$0.65` means the market believes there's a 65% chance the event happens.**
That's not a metaphor. The price literally is the probability estimate, derived from every dollar that's been put on both sides. It's a real-money consensus — people backing their beliefs with capital.
If YES is `$0.72`, NO is approximately `$0.28`. Always. If you ever see them not summing to \~`$1,` that's a spread or rounding artifact.
YES goes from `$0.40` to `$0.55`? The market just shifted from "probably not" to "coin flip, leaning yes." Watch for what caused the move.
## The numbers that matter
Cumulative USDC that's been traded in this market across all time. High volume = lots of interest and usually better price discovery. A `$10M` volume market has been stress-tested by thousands of traders. A `$50K` market might still be finding its price.
How much you can buy or sell without moving the price. High liquidity means your `$500` order fills at roughly the displayed price. Low liquidity means your order eats through the book and you get a worse average price (slippage).
Rule of thumb: if your order is more than 5-10% of visible liquidity, use a limit order.
If the best buy for YES is `$0.64` and the best sell is `$0.66`, the spread is `$0.02` (2 cents). Tight spreads = healthy, liquid market. Wide spreads = be careful, you're paying a premium to enter and exit.
How much the price moved in the last 24 hours. A +5% move on a market that's been flat for weeks might signal new information entering the market. But don't chase momentum blindly — the move might already be priced in.
## Reading signals from prices
YES at `$0.92`. The market is very confident this happens. Buying YES here means you're paying `$0.92` to potentially make `$0.08`. That's a terrible risk/reward **unless** you're nearly certain. Conversely, if you think the market is wrong, buying NO at `$0.08` gives you 12x if it doesn't happen.
YES at `$0.48`-`$0.52`. The market has no idea. This is a coin flip in the market's view. These markets are interesting when you have genuine insight that pushes the true probability away from 50%.
YES moved from `$0.30` to `$0.55` in 24 hours. Something happened. Check the news, check the AI signal reasoning. Is this a justified repricing or an overreaction? Overreactions are where the money is.
Supermission's AI signals compare the market price against the AI's independent probability estimate. When those diverge — say, market at `$0.40` and AI at `$0.65` — that's the signal. The bigger the gap, the stronger the conviction.
Every number on a market card is telling you something. Once you learn to read them, you see the market differently. This takes 2 minutes.
## Price = probability
The single most important thing to internalize:
**A YES price of `$0.65` means the market believes there's a 65% chance the event happens.**
That's not a metaphor. The price literally is the probability estimate, derived from every dollar that's been put on both sides. It's a real-money consensus — people backing their beliefs with capital.
If YES is `$0.72`, NO is approximately `$0.28`. Always. If you ever see them not summing to \~`$1,` that's a spread or rounding artifact.
YES goes from `$0.40` to `$0.55`? The market just shifted from "probably not" to "coin flip, leaning yes." Watch for what caused the move.
## The numbers that matter
Cumulative USDC that's been traded in this market across all time. High volume = lots of interest and usually better price discovery. A `$10M` volume market has been stress-tested by thousands of traders. A `$50K` market might still be finding its price.
How much you can buy or sell without moving the price. High liquidity means your `$500` order fills at roughly the displayed price. Low liquidity means your order eats through the book and you get a worse average price (slippage).
Rule of thumb: if your order is more than 5-10% of visible liquidity, use a limit order.
If the best buy for YES is `$0.64` and the best sell is `$0.66`, the spread is `$0.02` (2 cents). Tight spreads = healthy, liquid market. Wide spreads = be careful, you're paying a premium to enter and exit.
How much the price moved in the last 24 hours. A +5% move on a market that's been flat for weeks might signal new information entering the market. But don't chase momentum blindly — the move might already be priced in.
## Reading signals from prices
YES at `$0.92`. The market is very confident this happens. Buying YES here means you're paying `$0.92` to potentially make `$0.08`. That's a terrible risk/reward **unless** you're nearly certain. Conversely, if you think the market is wrong, buying NO at `$0.08` gives you 12x if it doesn't happen.
YES at `$0.48`-`$0.52`. The market has no idea. This is a coin flip in the market's view. These markets are interesting when you have genuine insight that pushes the true probability away from 50%.
YES moved from `$0.30` to `$0.55` in 24 hours. Something happened. Check the news, check the AI signal reasoning. Is this a justified repricing or an overreaction? Overreactions are where the money is.
Supermission's AI signals compare the market price against the AI's independent probability estimate. When those diverge — say, market at `$0.40` and AI at `$0.65` — that's the signal. The bigger the gap, the stronger the conviction.